Exploratory Analysis
Some visitors do not want pre-packaged insights. Instead they want to query the data themselves to validate their hypothesis themselves. This tool helps visitors do just that.
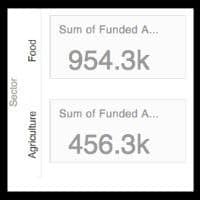
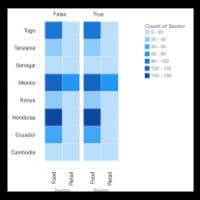
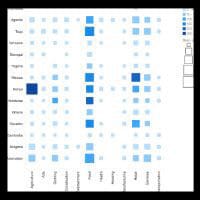
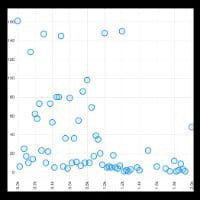
We think this problem was solved masterfully by Excel Pivot Tables! Experience visual pivot tables in browser.
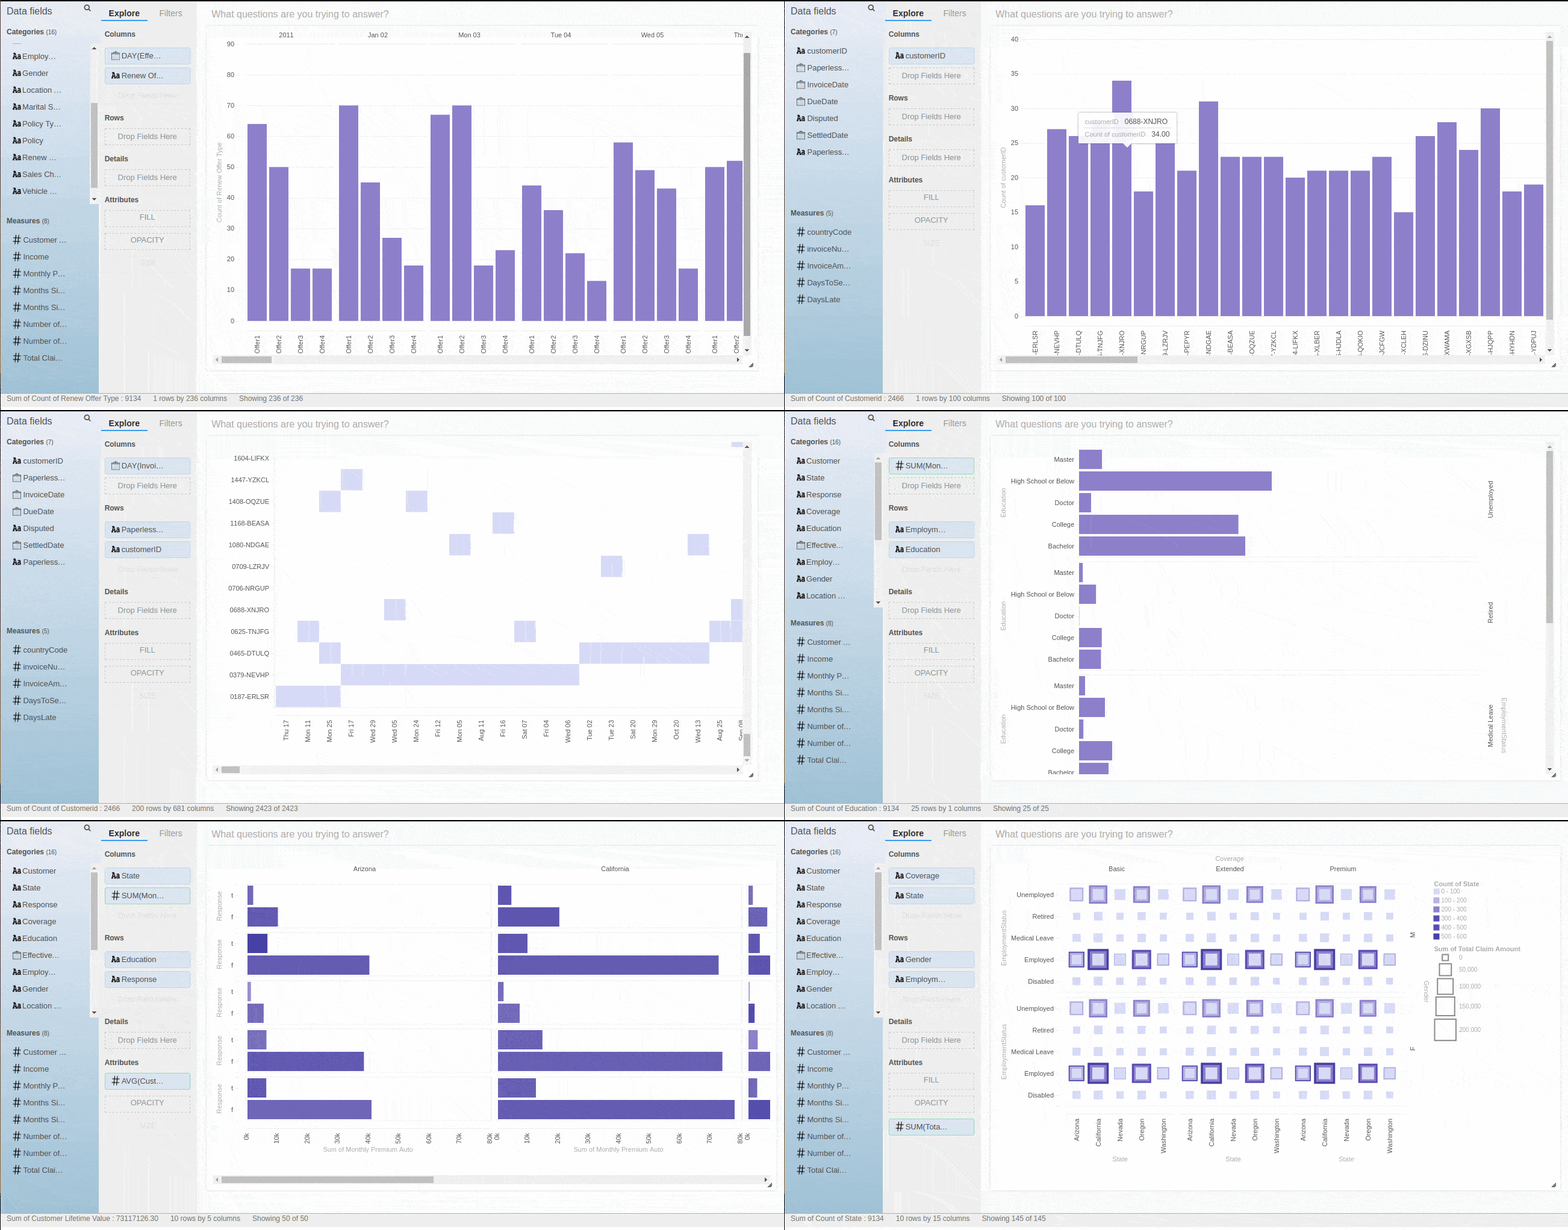
No SQL training required
Once you have selected a subset from your dataset for your line of inquiry, simply click “Explore” to see a drag drop visual query interface.
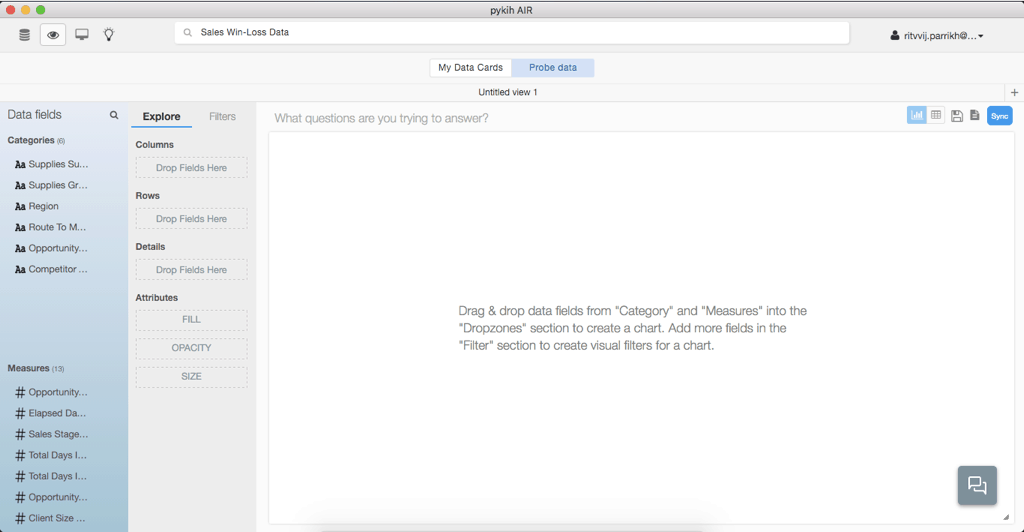
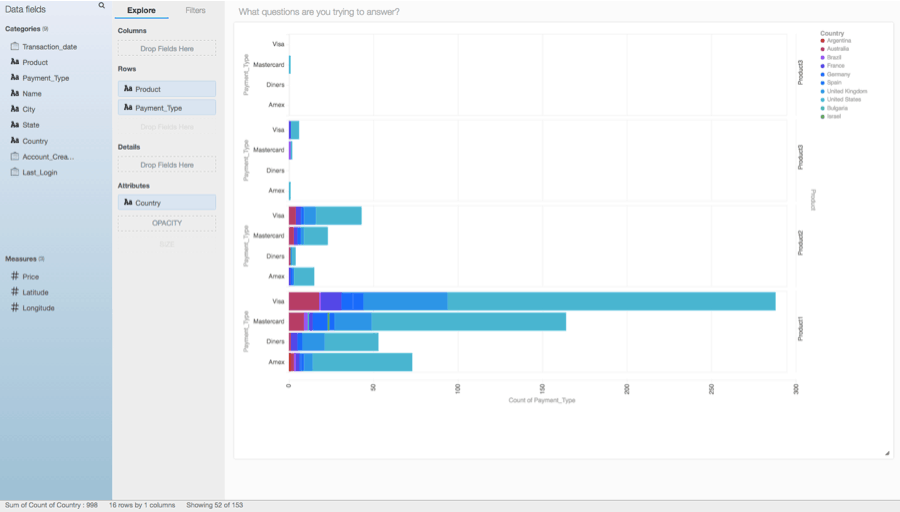
No data visualization skill required
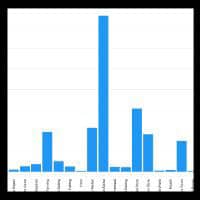
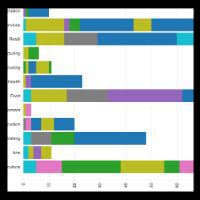
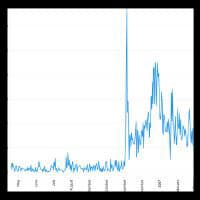
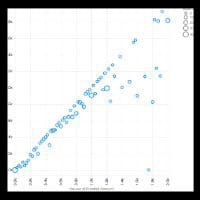
Simply drag and drop columns and pivot chart decides which is the right chart to be visualised based on the columns selected. It currently supports 12 different charts.
No need to install anything
Probe was designed to work with little datasets that are relevant and actionable. Hence, it works in-browser without any widgets or plugins installations needed. Simply load the page and start querying.


